

Most of my recent SkyeEngine writing has been about models, corpora and the machinery needed to build them. Running all of that is a different problem. The GPU workers, storage, inference services and tools don’t necessarily share a rack, a provider or even a country.
I built SkyeEngine Fabric to connect those pieces. It is a secure overlay with one identity system and one way for services to find each other. Coordinators form a hierarchy, clients attach at the edges, and traffic can cross the Fabric without every service needing to know how the physical network underneath is arranged.
Until recently, much of this existed as architecture and individually tested components. Over roughly ten very busy days I brought the whole thing up, put it under load, broke it on purpose, fixed what fell out and deployed it again. Some of the results were good. A few of the early ones were impressively bad.
The implementation, test harnesses and detailed results are private. This is the public account of what I tested and what I found.
Building the Five-Coordinator Network
The first milestone was deceptively simple: run the intended topology end to end.
Fabric has a root coordinator, a distribution tier and access coordinators at the edge. The root controls identity and global state without becoming a transit router for every byte. Distribution coordinators carry routes between parts of the network. Access coordinators accept clients such as inference containers, storage services and tools.
I assembled a five-coordinator network with a root, two distribution nodes and two access nodes, including the cross-link which lets the two distribution branches reach each other without sending ordinary traffic through the root.
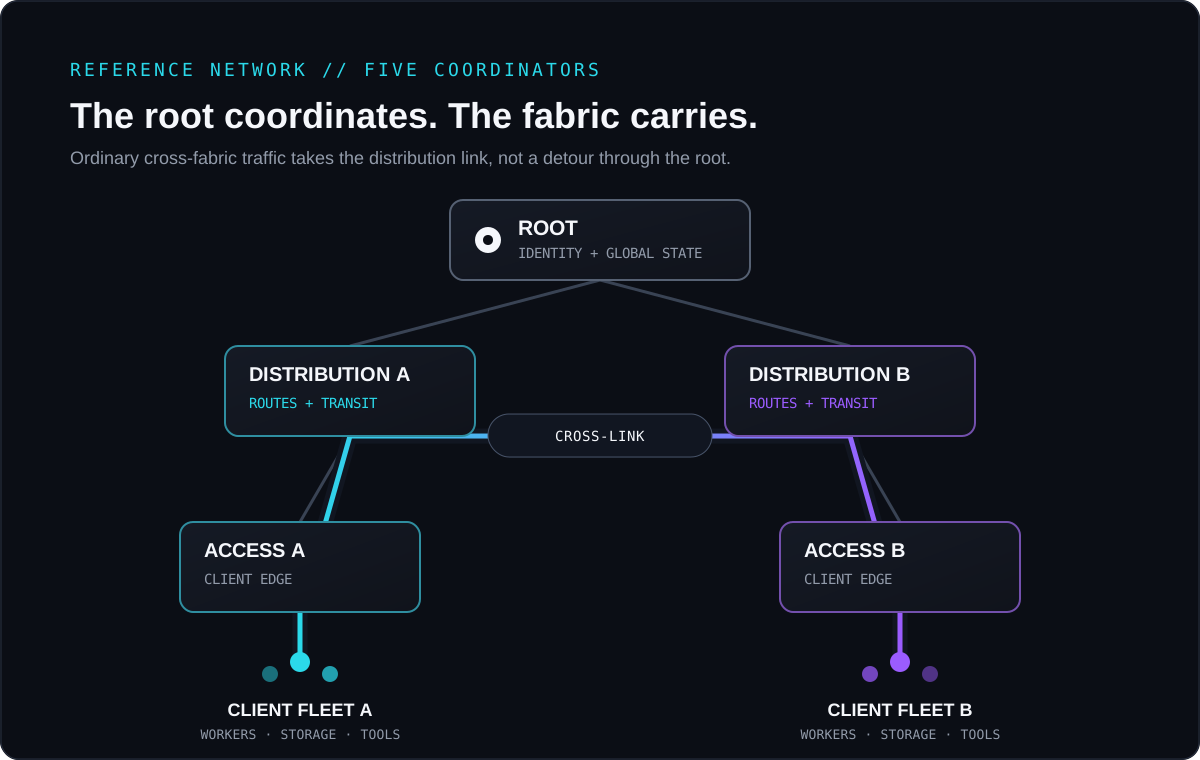
The reference topology separates global coordination from the ordinary client traffic path.
That first complete bring-up found exactly the sort of faults integration tests are supposed to find. The workspace was not reproducible from a clean build. Database migrations made assumptions about the current directory. Registration tokens could not actually be reused as configured. Several settings were decorative while developer paths remained hard-coded. A newly registered coordinator could briefly serve the wrong kind of socket before its certificate arrived. Some status fields reported plausible-looking nonsense.
None of these were intellectually glamorous failures. Collectively, they were the difference between software which compiled and a network which formed.
The result is now a containerised five-node reference environment which bootstraps from empty state, registers every coordinator, establishes mutual TLS links, converges on the expected routes and checks that traffic really crosses the intended path. A bounded version of that process also runs in CI against a fresh stack.
Adding Enough Instrumentation
Once the network stayed up, the project shifted from “does it start?” to “what is it doing?”
I added telemetry for clients, links, routes, queues, handlers, authentication, message paths, verification, compression, file relays and resource use. Prometheus records the time series and Grafana gets the same provisioned dashboards every time. The load generators also report their own active sessions and requests, so I can compare their view with what the coordinators think is happening.
The test harness also captures process-level evidence which ordinary service metrics miss: threads, file descriptors, mappings, anonymous memory, container restart counts and kernel limits. Soak analysis checks coverage as well as slopes. A perfectly flat graph from a process which died eleven hours ago is no longer accepted as excellent stability.
I know this because the first version happily did exactly that.
An early security-enforcement soak killed four of five coordinators after approximately one hour. Their certificate caches expired, a replay-protection assumption caused nodes to reject messages they had signed themselves, route validation failed, and the peers deliberately exited. The reporting tool later announced that no growth had been detected because it never checked whether most of the processes were still present.
The failure gave me plenty to fix. I corrected the replay logic, closed an adjacent signature-validation bypass, made restart behaviour explicit and tested the soak gate against both passing and failing evidence. I also extended the test, because an hour-long cache obviously can’t be validated by a run which ends after fifty minutes.
The clean post-fix soak ran for 13.7 hours. I accepted it with a duration waiver instead of calling it the planned 24-hour run. All five coordinators stayed alive with zero container restarts, resource curves remained bounded, pending work drained and 39,896 envelope verifications completed without a failed, rejected or unverifiable result. The graphs had been flat for long enough that I didn’t expect another ten hours to reveal much, but almost 14 hours is still not 24 hours.
Finding the Five-Millisecond Delay
File-transfer testing produced the most satisfying single performance result.
The first measured implementation moved data at about 169 MB/s while the underlying link, storage and CPUs all appeared to have room. The obvious suspects were buffer sizes and flow-control windows. They were not the problem.
I eventually found a fixed five-millisecond timer in the connection driver. The function behind it drove the entire multiplexer, so reads, writes, flow-control updates and wake-ups were all waiting behind a gate which opened only 200 times per second.
Replacing that polling loop with the runtime’s real wake-up mechanism, then overlapping the file stages correctly, moved the same in-memory transfer from 168.9 MB/s to 628 MB/s: a 3.7× improvement. Peak memory also fell because frames no longer accumulated while waiting for the next tick.
The investigation corrected several benchmarks along the way. A supposedly very fast disk test was writing compressible zeroes to ZFS and mostly measuring compression. A 2 GiB container limit made the kernel reclaim memory throughout a 2 GiB transfer, quietly cutting throughput in half. A receiver intended to discard data for a transport-only measurement was initially slower than writing it because the synthetic path had changed how buffers were allocated.
The larger number was nice, but fixing the benchmark was just as useful. It now explains where the time and CPU went, verifies the bytes end to end and rejects a result when the measurement path changes the system more than the optimisation being tested.
Moving File Transfer to the Clients
That performance work also exposed a design mistake: coordinators are the network, not the endpoints.
The real transfer is between clients—a model worker and a file server, for example—not between two coordinators. Fabric now brokers a direct client-to-client connection when the endpoints can reach each other and provides a cut-through relay when they cannot. The sender can request direct, relay or automatic selection, and the acceptance test verifies the chosen path independently instead of trusting the sender’s label.
The direct path carries no file bytes through a coordinator. Fabric still authorises the introduction and records both ends’ audit reports, so it can say who moved what, which path was used and whether both clients verified the same transfer without pretending it inspected traffic it never saw.
On the local transport-only harness, the direct path reached a median 1,832 MB/s, while a one-coordinator relay reached 950 MB/s. With real disk writes enabled, both converged around 590 MB/s because the disk—not Fabric—became the ceiling. Those are laboratory numbers from one machine, not internet throughput claims, but they show that the primary and fallback designs both work and that the instrument can tell transport from storage.
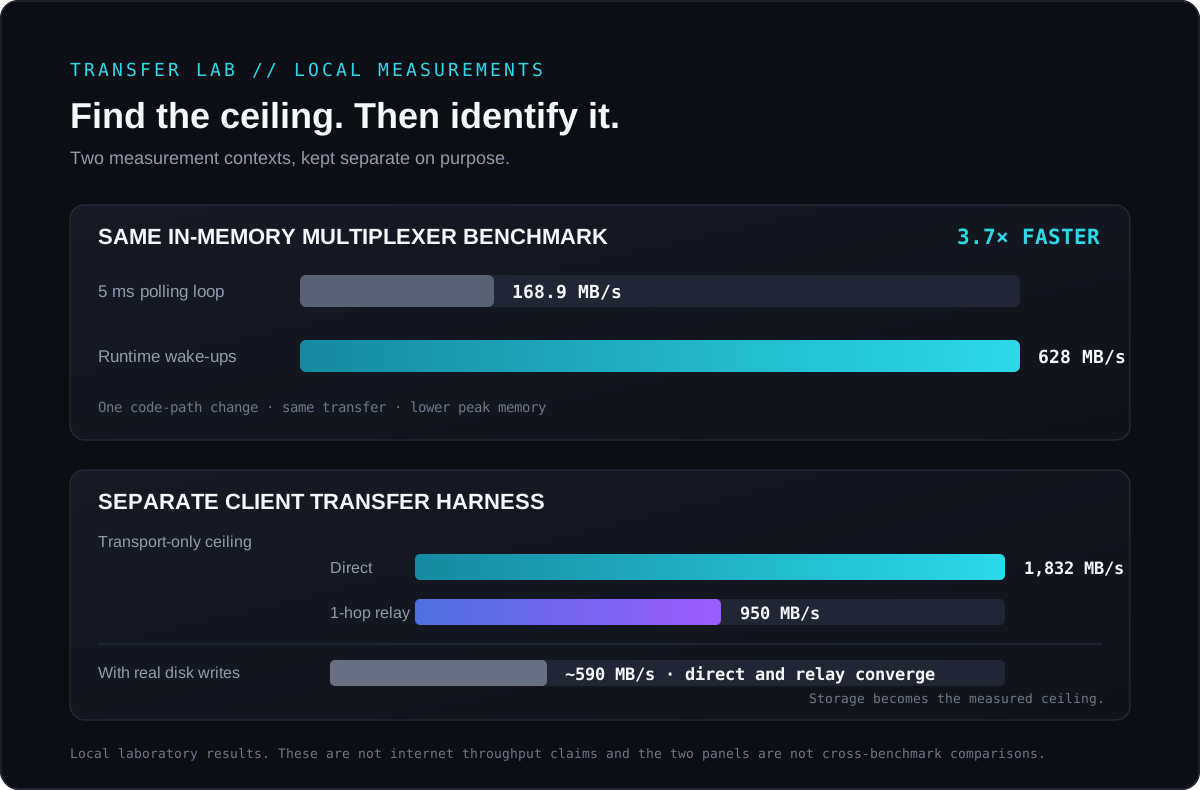
The panels deliberately separate the multiplexer benchmark from the later client-transfer harness.
I also tested the transport under controlled bandwidth, delay and loss. On a difficult shaped path, TCP with BBR and QUIC with BBR were effectively tied. TCP with the default loss-based controller collapsed. On an idle fast link, kernel TCP was several times faster than the userspace QUIC implementation. I therefore kept TCP, TLS and BBR for the first version. In these tests, the congestion controller made the difference, not switching to QUIC.
Testing on Rented Servers
Local containers are excellent for correctness and profiling. They are a poor substitute for multiple machines when the question is whether a distributed system behaves like one.
I rented eight dedicated-CPU servers with 62 vCPUs in total: five Fabric coordinators, an observer and two independent load generators connected over a private network. Public interfaces were used for management only; the service ports weren’t reachable from the public internet. I scripted the network, firewalls, machines, credentials, immutable container image, verification, evidence export and teardown so I could rerun it without remembering what I had typed the previous evening.
The main capacity run held 5,000 authenticated clients on each access coordinator, or 10,000 simultaneous client sessions. Every scheduled plateau was reached. The balanced run completed 26,902 cross-fabric requests with 100% success. The deliberately skewed run completed 32,904 of 32,905; the single timeout occurred during the intentional final drain while sessions were being closed and remained well inside the frozen acceptance threshold.
Stable request latency was comfortably below the predeclared gates: p50 was approximately 4–18 ms and measured p99 approximately 25–49 ms. At the balanced 10,000-client plateau, the generators and coordinators used surprisingly little CPU, queues did not accumulate, and every stable sample agreed exactly between generator session counts and coordinator-authenticated client counts.
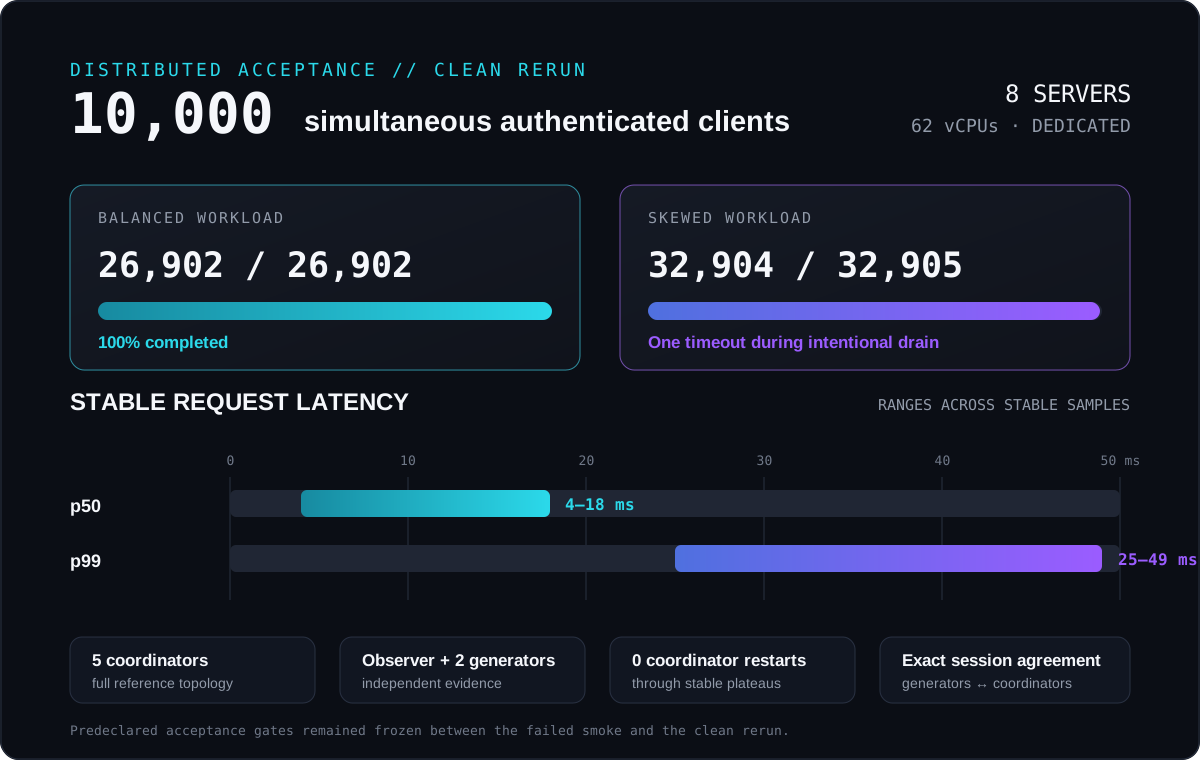
The clean rerun used the same frozen gates as the failed smoke which preceded it.
That clean result was a rerun. The first remote smoke reached its client target but sent most requests to registered identities which were not actually online. The resulting success rate was awful and completely correct for the broken workload. The failed run was retained, the load protocol was fixed, a new immutable image was built, and the test started again without changing the thresholds.
I’ve run into this more than once now: a benchmark can execute perfectly and still test the wrong thing.
Restarts, Churn and Other Unpleasant Cases
I reused the same paid cluster window for several sequential tests. Running unrelated benchmarks at the same time would have made all of the results harder to trust.
During route recovery, cross-subtree client traffic continued while a distribution coordinator received a graceful stop, an abrupt kill and a full recreation. The original topology and route set returned without manual intervention after outages of approximately 15, 45 and 90 seconds respectively. Queues drained, no unrelated coordinator restarted, and the final queue-latency p99 remained under half a millisecond.
The identity-churn test connected and drained 7,500 distinct clients, introduced 32 deliberate authentication stalls, restarted an access coordinator during the 2,500-session plateau, and then proved that a previously unused identity could still connect afterward. Active clients, pending requests, data handlers and DNS state all returned to baseline. The coordinator-certificate cache remained unchanged, which is the correct result: it contains coordinator certificates, not one entry for every client which ever visited.
Compression received its own protocol matrix. Every one of the 55 supported message types was named exactly once, including explicit exclusions rather than a vague “all messages passed.” Live traffic covered peer-to-peer, peer-to-root, root-to-peer, local, relayed and request/response paths. Compiled regressions covered negotiation, thresholds, both supported formats, incompressible input, malformed input, size limits and encoder reuse. The run completed without decompression errors, connection loss or unbounded resource behaviour.
After each stage, the observer exported an immutable bundle containing the Prometheus snapshot, Grafana configuration, machine-readable results, node facts, image and configuration identities, and checksums. Those bundles were opened locally before the cluster was destroyed. The dashboards still work after the expensive machines no longer exist, which makes analysis independent of the billing clock and means a result is more than a screenshot someone remembered to take.
Testing the Protocol Signatures
A large portion of the work was less visible but more important than a throughput graph.
Fabric envelopes were already carrying signatures, but several paths did not consistently verify them. The enforcement work centralized what a signature covers, signed the last unsigned handshake path, removed duplicate protocol implementations, repaired replay handling across reordering and restarts, and ran the full network with verification in enforce mode.
Registration errors now propagate instead of being translated into misleading success. Certificate caches are bounded. Client and peer shutdowns drain cleanly. Coordinators recover after host and container-runtime restarts. Status reports distinguish links from routes. Dead transfer protocols and configuration switches were removed instead of being documented forever as theoretical capabilities.
Perhaps most importantly, these properties are now represented in end-to-end tests. “The code appears to verify this” is weaker evidence than a five-node network refusing a forged message while continuing to route legitimate ones.
What I Still Need to Test
I closed a large group of correctness, operability, security and acceptance tasks, but Fabric isn’t finished and I still don’t have one magical maximum-throughput number.
The local transfer harness has a restart-dependent throughput variance which is stable within one process lifetime and different after recreation. Direct connections also show more run-to-run spread than relayed transfers. The current machines cannot cleanly separate physical-host placement, virtual networking and Fabric itself.
The next serious file-transfer run therefore needs a deliberately different environment: separate endpoint hosts, independent local NVMe, a stable high-speed private link, full kernel control for BBR and traffic shaping, and the complete Fabric topology deployed alongside the clients. A 10 Gb/s environment is realistic for acceptance, while a faster or bare-metal run may still be needed to characterize the absolute direct-path ceiling.
I want to design that environment properly instead of improvising it during another paid test window. Until then, the throughput variance stays open rather than being averaged into a nicer-looking number.
There is still plenty to build. What changed is that Fabric now has a repeatable way to expose faulty assumptions.
It can form a real network, authenticate and route for 10,000 concurrent clients, recover from deliberately removed coordinators, clean up after churn, broker direct transfers, relay when direct is impossible, enforce its signed protocol, export its own evidence and survive after the test cluster has been deleted.
For roughly ten days of testing, I’m quite happy with where it ended up. Fabric still has plenty of unfinished edges, but I can now reproduce a complete network, break it in several known ways and tell whether it recovered. That is much more useful than another diagram claiming it should work.
Figures in this post describe the verified development and acceptance runs completed through 6 August 2026. Local transfer numbers are laboratory measurements, not promises about internet throughput. The post-fix soak ran for 13.7 hours with an explicit duration waiver; it is not represented as a completed 24-hour run.