

I ended my last SkyeEngine Fabric post with an unresolved problem. The client-to-client transfer design worked, but the fastest numbers came from containers on one machine. Restarting those containers could move the result, and the available remote environment could not cleanly separate Fabric from shared storage, shared CPUs and virtual networking.
That sentence became a test plan.
I have now run the transfer campaign on seven DigitalOcean Droplets connected by a private 10 Gb/s network. The short result is that direct Fabric transfers reached a median 1,189.3 MB/s on fresh endpoints, or about 9.51 Gb/s of file data. A forced four-coordinator relay reached 615.9 MB/s. Direct transfer came within roughly 2% of the raw private-network baseline, relay memory stayed bounded while payloads grew from 1 to 8 GiB, and every measured file passed independent integrity checks at both ends.
The less convenient result is that relay throughput changed by 5.5% when I replaced both endpoint machines. That narrowly missed the provisional 5% repeatability gate. I am accepting the campaign, but not sanding that edge off the result.
A Network Designed to Answer One Question
The earlier rented-server tests were about Fabric as a distributed control plane. They exercised 10,000 simultaneous authenticated clients, route recovery, identity churn, compression, signature enforcement and coordinator restarts. They were useful tests and the wrong environment for a serious file-transfer number.
This environment was built around the data path instead.
It had a root coordinator, two distribution coordinators and two access coordinators, plus separate source and receiver machines. The four peer coordinators and both endpoints used dedicated-CPU plans. The small root did not carry file data. The endpoint plans provided large local storage, and all Fabric and transfer traffic stayed on a private VPC. Public addresses existed for management, with every non-SSH service port blocked.
The relay route crossed access-a, distribution-a, distribution-b and access-b. The direct route still used Fabric for identity, authorisation, endpoint introduction and audit, but the file bytes moved straight between the two clients. That is the architectural distinction I wanted the benchmark to preserve.
Before running Fabric at all, repeated iperf3 tests measured approximately 9.70–9.74 Gb/s in both directions. Source storage produced 1.23 GB/s writes and 4.75 GB/s reads under the direct-I/O preflight; the receiver produced 1.53 GB/s writes and 1.48 GB/s reads. Those were not performance claims for Fabric. They were the ceilings against which its results would have to make sense.
The Smoke Test Was Not the Benchmark
The first infrastructure smoke moved 64 MiB at 494.8 MB/s direct and 292.9 MB/s relayed. Both paths verified the payload and used the expected route, so it did its job: the machines, network, credentials and protocol could form a working system.
It was also a poor steady-state throughput measurement. With such a short payload, connection setup, authorisation and measurement granularity occupy a large fraction of the run. Moving to an 8 GiB payload more than doubled both results without changing the implementation.
The previous one-host laboratory numbers had the opposite problem. They reached 1,832 MB/s direct and 950 MB/s relayed, but both clients shared one kernel, one physical host and a memory path. They were useful for profiling the implementation. They were never evidence that Fabric would move 14.7 Gb/s between real machines.
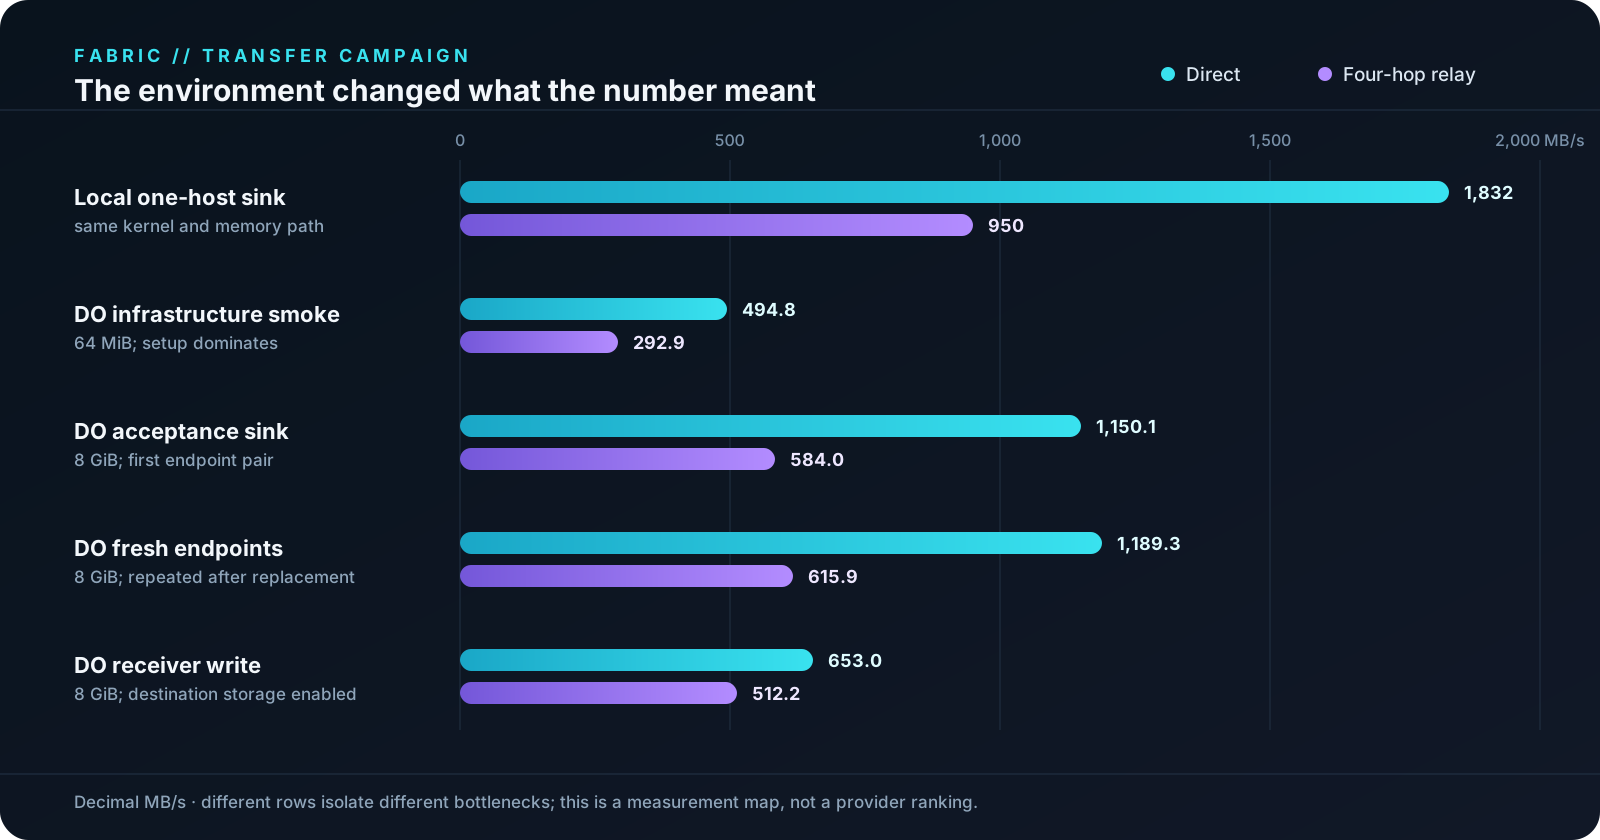
Different rows remove different bottlenecks. Reading this as a provider leaderboard would miss the point.
The 8 GiB sink baseline on the first endpoint pair reached 1,150.1 MB/s direct and 584.0 MB/s relayed. After replacing both endpoint Droplets from the same immutable snapshot, repeating preflight and registering fresh Fabric identities, the five-round medians rose to 1,189.3 and 615.9 MB/s respectively.
The fresh direct result corresponds to about 9.51 Gb/s, against a fresh raw-network median of 9.73 Gb/s. That puts the direct path at approximately 97.8% of the measured VPC baseline. There is not much unexplained network left in that case.
Watching the Four-Hop Relay
The relay has a different shape. Every byte crosses four coordinator processes, each enforcing the Fabric path while forwarding data without accumulating the whole file. Its first sink median was 584.0 MB/s and its fresh-endpoint median was 615.9 MB/s, equivalent to roughly 4.7–4.9 Gb/s of end-to-end file data.
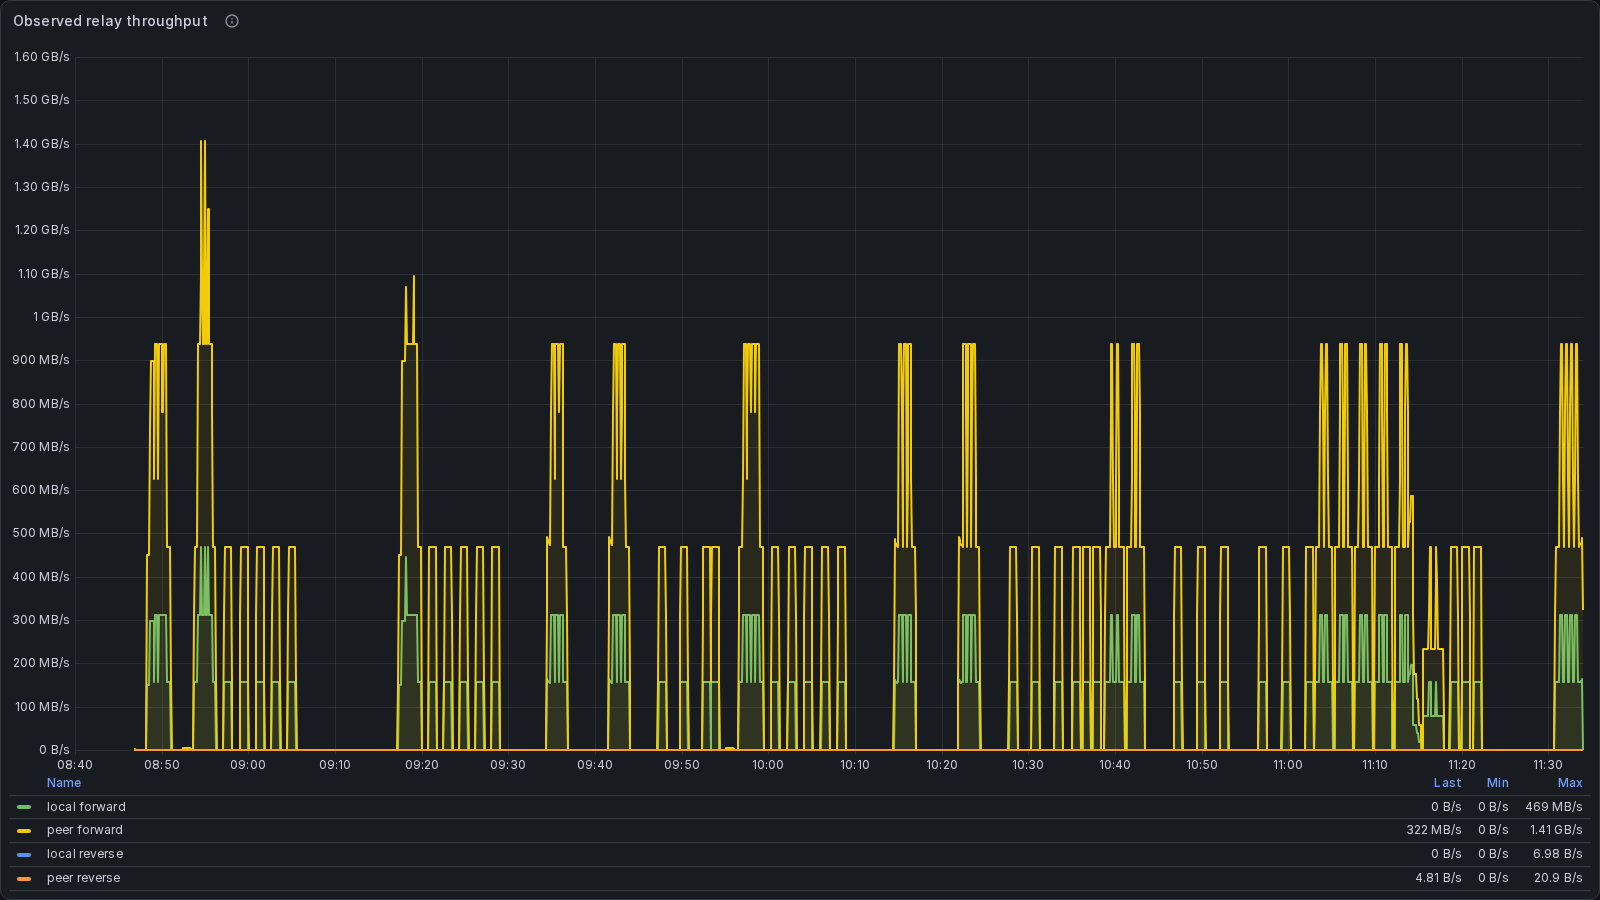
The repeated blocks are separate test stages. This panel uses one-minute rolling counter rates and includes multiple coordinator hops; the benchmark medians come from the per-transfer result ledger rather than the visual peak.
The Grafana trace makes the campaign structure visible: correctness checks, sink runs, receiver writes, congestion-control transitions, network-shaping profiles, endpoint reincarnations, the memory ladder and the final repeat. Direct file bytes are deliberately absent from this graph because coordinators do not carry them.
The coordinator-flow panel provided the second half of that check. Direct transfers produced no relay-complete records. Forced relay produced records on all four expected coordinators and traffic on the expected access-a → distribution-a → distribution-b → access-b path. Automatic mode fell back to that relay when I disabled direct listening, while strict-direct mode failed loudly instead of quietly changing the test.
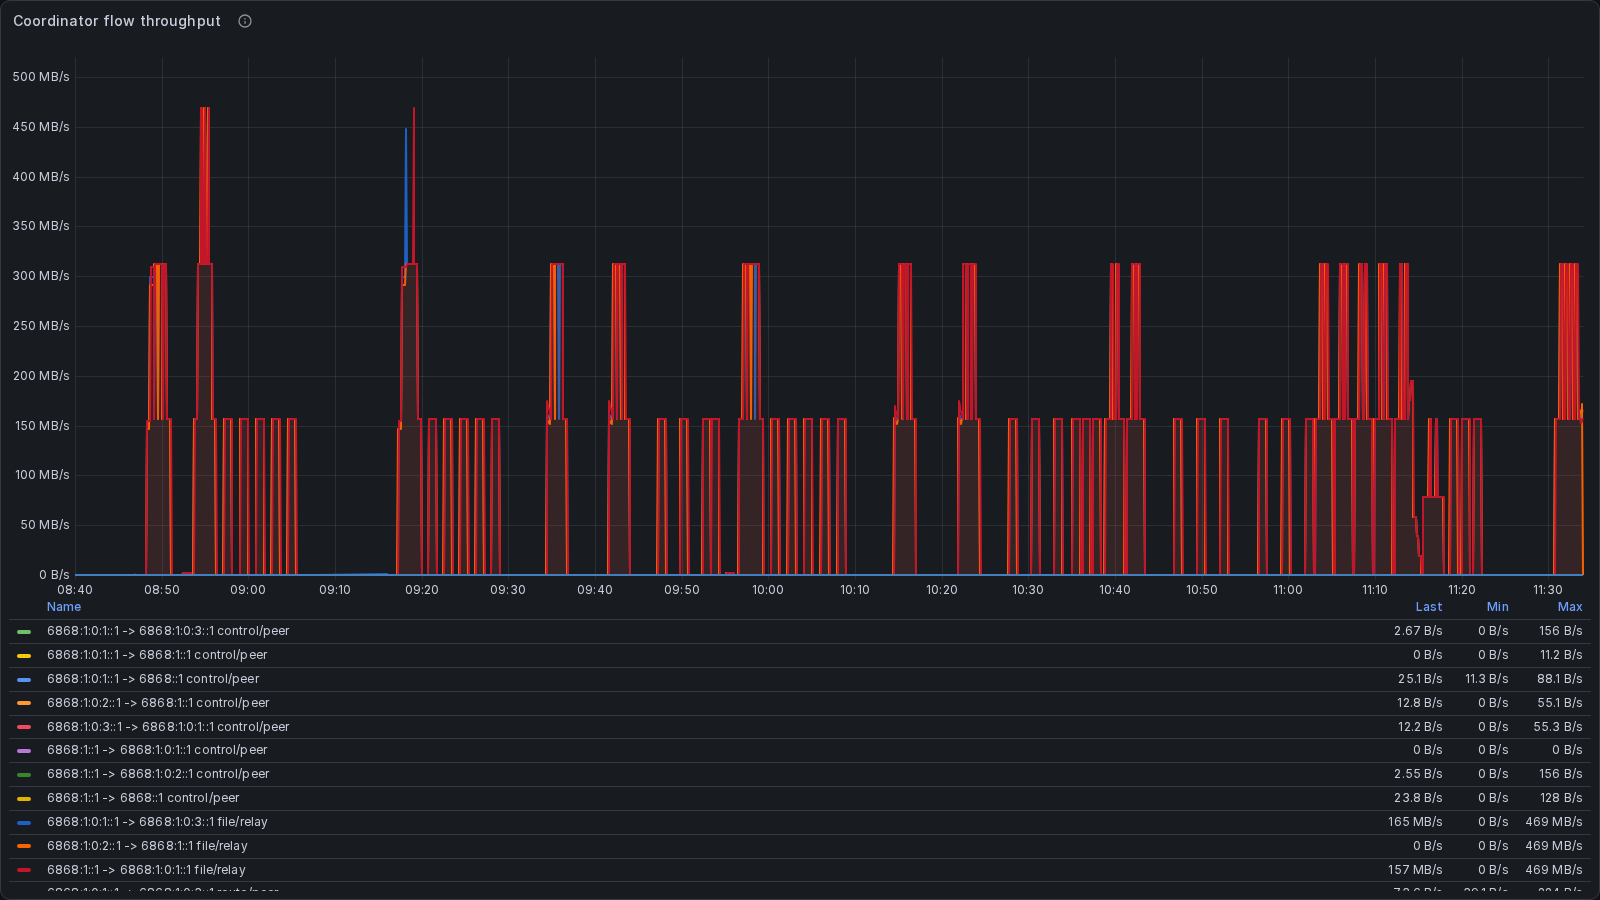
The addresses in the legend are Fabric identities from the preserved evidence, not public endpoint addresses.
Every correctness case used SHA-256 plus an in-band BLAKE3 check. Both access coordinators recorded matching audit halves, and all ten receiver-write samples independently matched the source digest. A throughput number without those checks would only prove that some bytes went somewhere quickly.
Adding Bandwidth, Delay and Loss
An unshaped data-centre link is the easiest possible network. I also imposed six profiles on endpoint egress so the two directions together produced the requested round-trip delay:
| Network profile | Direct | Four-hop relay |
|---|---|---|
| 1 Gb/s, 20 ms RTT | 111.2 MB/s | 111.4 MB/s |
| 2.5 Gb/s, 20 ms RTT | 278.5 MB/s | 279.5 MB/s |
| 5 Gb/s, 20 ms RTT | 551.7 MB/s | 538.9 MB/s |
| 10 Gb/s, 20 ms RTT | 839.9 MB/s | 609.3 MB/s |
| 1 Gb/s, 30 ms RTT, 0.1% loss | 110.8 MB/s | 111.2 MB/s |
| 1 Gb/s, 60 ms RTT, 0.5% loss | 110.2 MB/s | 110.5 MB/s |
Below 2.5 Gb/s, path selection barely mattered: both modes were constrained by the network. At 5 Gb/s the two remained close. At 10 Gb/s with 20 ms of round-trip delay, direct pulled away while relay was already near its unshaped ceiling. That is a much more useful boundary than declaring one universal Fabric speed.
The loss profiles also held close to the 1 Gb/s shaped result under BBR. Cubic was directionally slower on the unshaped baseline—1,016.4 MB/s direct and 558.6 MB/s relay, against 1,099.1 and 590.8 MB/s after restoring BBR—but I do not have enough independent environments to turn that difference into a general congestion-control claim. The distributions and endpoint variance are large enough that “BBR won this matrix” is safer than “BBR is always 8% faster.”
Storage Became the Next Ceiling
Sink mode deliberately discards received bytes after verification so it can measure the transport. Enabling receiver writes reduced the medians to 653.0 MB/s direct and 512.2 MB/s relayed.
That convergence is important. Direct still had almost twice the transport headroom of relay, but only 27% more throughput once the receiver stored the file. Optimising the direct network path would not make that particular workload twice as fast. Faster storage, deeper I/O overlap or a workload which can consume data as it arrives would matter more.
This is also why I do not want one headline number in the API or README. A model checkpoint copied into memory, a dataset persisted to local storage and a transfer crossing a lossy WAN are three different measurements even when they use the same protocol.
The Coordinators Did Not Buffer the File
The forced-relay memory ladder sent 1, 4 and 8 GiB payloads through a 1 Gb/s, 20 ms path. If the implementation retained data in proportion to the file, coordinator RSS should have climbed with every rung.
It did not.
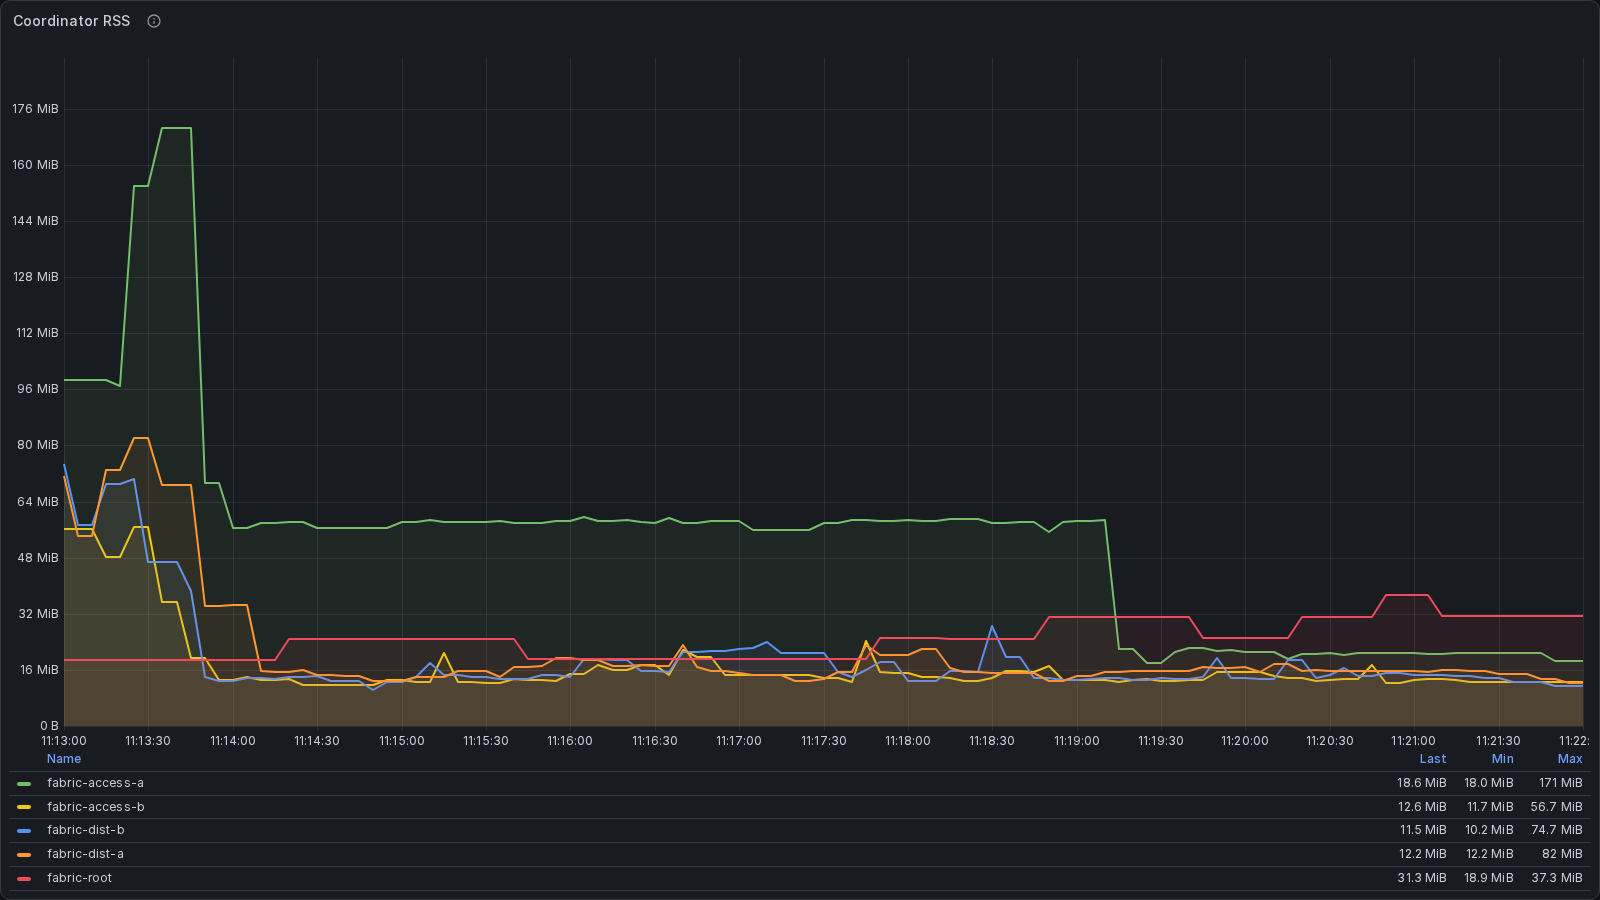
The largest per-coordinator observation was about 171 MiB during the 1 GiB rung. The largest values during the 4 and 8 GiB rungs were about 60 MiB.
The graph is non-monotonic because connection setup, allocator behaviour and scrape timing are more visible than file size once forwarding is streaming correctly. The 8 GiB relay still held exactly 111.4 MB/s under the shaped 1 Gb/s profile. This is the result I cared about more than a low idle-memory number: the forwarding path stayed bounded while doing sustained work.
Repeatability Was Almost Boring
Five receiver-container incarnations on the first machine produced per-incarnation medians of 1,027.0–1,179.0 MB/s direct and 581.1–605.7 MB/s relayed. Each incarnation used a fresh sender container per transfer. That variation confirmed the local warning: process and endpoint lifetime can move a benchmark even when the code and nominal machine do not change.
Replacing both endpoint Droplets was therefore a separate acceptance stage, not an afterthought. The new pair repeated the raw network and storage preflight, received new Fabric identities and ran the same five-round 8 GiB baseline against the unchanged coordinator network.
Direct changed by +3.4% and stayed within the provisional 5% cross-incarnation gate. Relay changed by +5.5% and missed it narrowly. The fresh relay run itself was fairly tight, with 3.6% range-to-median spread; the first endpoint’s relay samples had an 11.25% spread. My conclusion is not that relay is unstable, nor that 615.9 MB/s is the one true number. It is that its current ceiling sits around 600 MB/s in this environment and needs another independent run before I would advertise a tighter tolerance.
The Failed Runs Stayed in the Evidence
The clean suite was the fourth full attempt. The first hit OpenSSH connection throttling while public scanners competed with the management harness. The second raced route propagation after restarting peer coordinators for the Cubic test. The third let an SSH child consume the remaining shell matrix and skipped five shaped profiles.
Those failures did not disappear when the harness was repaired. They remain in the evidence bundle and in the Grafana history. Management SSH now uses bounded connection attempts and multiplexing. Route readiness retries only the explicit pre-transfer “no route” refusal; integrity or transfer failures remain fatal. SSH children which should not read the test plan now receive null input, and suite completion requires proof that all six network profiles ran.
After the successful suite I exported and verified an offline Prometheus/Grafana snapshot, replaced the endpoints, ran the repeat, exported a second snapshot and then destroyed all seven paid Droplets. The final bundle contains 448 metric names plus machine-readable transfer results, host facts, logs, audits, image identity and checksums. The screenshots in this post came from that local copy after the expensive environment no longer existed.
The conservative catalogue-rate estimate for the complete cluster window was no more than $7.13 before tax. It is an estimate, not a provider invoice.
What I Think the Campaign Proved
The direct design is doing what it was supposed to do. Fabric can authorise and audit a client-to-client transfer without becoming its data plane, and on this test it reached 97.8% of the measured private-network baseline.
The relay is viable rather than ceremonial. It sustained roughly 600 MB/s through four coordinator processes, survived delay and loss, fell back automatically and did not buffer an 8 GiB file into memory. It is also now the obvious performance target: above roughly 5 Gb/s, relay mechanics—not the VPC—set the ceiling.
Storage can erase much of the difference between those paths. Short smokes can understate both of them. One-host benchmarks can overstate both of them. Congestion control, process lifetime and endpoint placement all move the result enough that they belong in the evidence rather than in footnotes added afterward.
Most importantly, I now have a repeatable environment and harness which can tell those explanations apart. I can close the transfer-acceptance task with a real result and one explicit repeatability caveat, rather than another attractive number from whichever run happened to be fastest.
Measurements were completed on 21 August 2026 in DigitalOcean FRA1. Throughput values are decimal MB/s; payload sizes are binary MiB/GiB. The 10 Gb/s description refers to the provider VPC class, whose measured bidirectional baseline was approximately 9.70–9.74 Gb/s. Grafana screenshots are from the verified offline evidence snapshot, not a live paid cluster.