
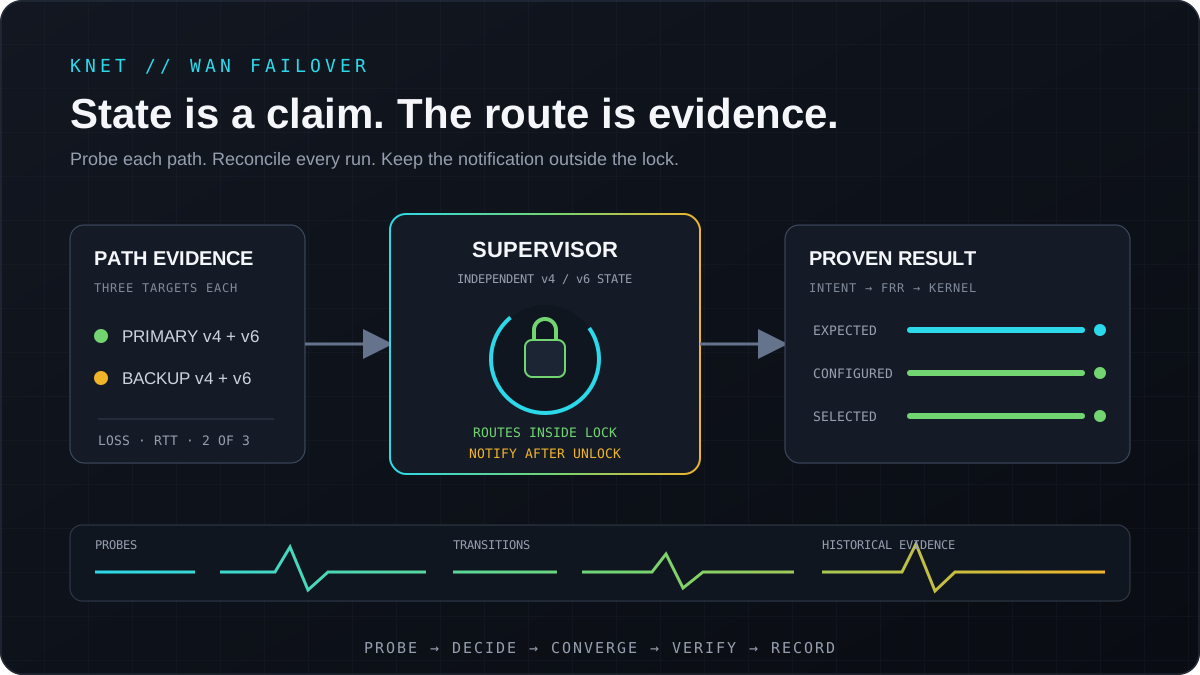
This morning r3 in Leipzig started producing the sort of alert storm which makes a dual-WAN setup look much less reassuring than it did on the diagram.
Both WANs appeared to flap. The local platform behind the router disappeared from monitoring. LTE traffic showed up when the failover state said the fixed line should still be active. For a while it looked like a provider failure, a broken failover controller and several dead hosts had all arrived together.
The first incident was not Vodafone at all. UniFi had helpfully updated switches again, despite this being a thing I keep trying to disable. Both WANs cross the same local LACP fabric before they become independent paths, so dropping that fabric can make two providers fail at once and take the downstream platform telemetry with them.
That explained the morning outage. It did not explain why the failover supervisor later tripped over its own lock while trying to send a notification.
Fixing that second incident turned into a fairly thorough rewrite of the boundary between route state, live routing, supervision and monitoring. It also produced a Grafana dashboard which can answer a question I could not answer cleanly yesterday: what did each part of the failover decision know, and when did it know it?
Two Incidents Which Looked Like One Problem
r3 has a fixed primary connection and a mobile backup. IPv4 and IPv6 fail over independently because one address family can fail while the other remains completely usable. Every minute, the supervisor tests both paths through their own interfaces and routing tables, counts consecutive results, and changes only the affected default route once the configured threshold is reached.
The early incident started below all of that. Two LACP members dropped together during an automatic switch update. Router telemetry, routing sessions and the Proxmox hosts behind the site all became noisy at roughly the same time.
That correlation mattered. Two providers becoming unreachable together is possible, but two local Ethernet members dropping at the same moment is a much better explanation when both services cross them. The incident was a local switching failure with a broad blast radius, not simultaneous bad luck from Vodafone and the mobile carrier.
Later, at 13:48, the primary IPv6 probes failed for the first time. The next round failed again, so at 13:49 the supervisor performed the IPv6 transition to LTE. IPv4 remained on the primary line.
At first it looked as though failover had not happened. The journal showed something more irritating:
| Time | What the supervisor did |
|---|---|
| 13:48 | First failed IPv6 round; counter moved to one of two |
| 13:49 | Second failed round; IPv6 route changed to LTE |
| 13:50 | Scheduled run skipped because the previous invocation still held the lock |
| 13:51 | Another scheduled run skipped for the same reason |
| 13:52 | Supervision resumed and recorded the first healthy recovery round |
The route transition had succeeded. The process then called the notification webhook while it still owned the execution lock. That request was slow enough for two one-minute scheduler invocations to collide with it and give up.
So the failover script had not failed in the obvious way. It had made the right routing decision and then temporarily blinded itself while announcing the decision.
The Lock Was Protecting Too Much
The lock exists for a good reason. Two supervisors must not edit policy rules, routes, counters or connection tracking at the same time.
A notification is different. It is best-effort work against an external service. Its latency has no business deciding whether the router performs the next health check.
I moved notification delivery outside the critical section and made sure the child process cannot inherit the lock descriptor. Notifications now have a short timeout of their own, while the complete supervisor run has a hard deadline comfortably below its one-minute schedule.
Lock contention is also visible independently. A blocked invocation cannot publish the ordinary end-of-run metrics because it never owns the main state, but it can safely increment a separate contention counter and timestamp. The dashboard now shows the latest run duration, whether it succeeded, the age of the last completion, how many invocations were skipped and when contention last happened.
That turns “the cron job probably ran” into something measurable. If a run approaches the scheduler interval, retains the lock or stops completing, Grafana has enough information to say which failure occurred.
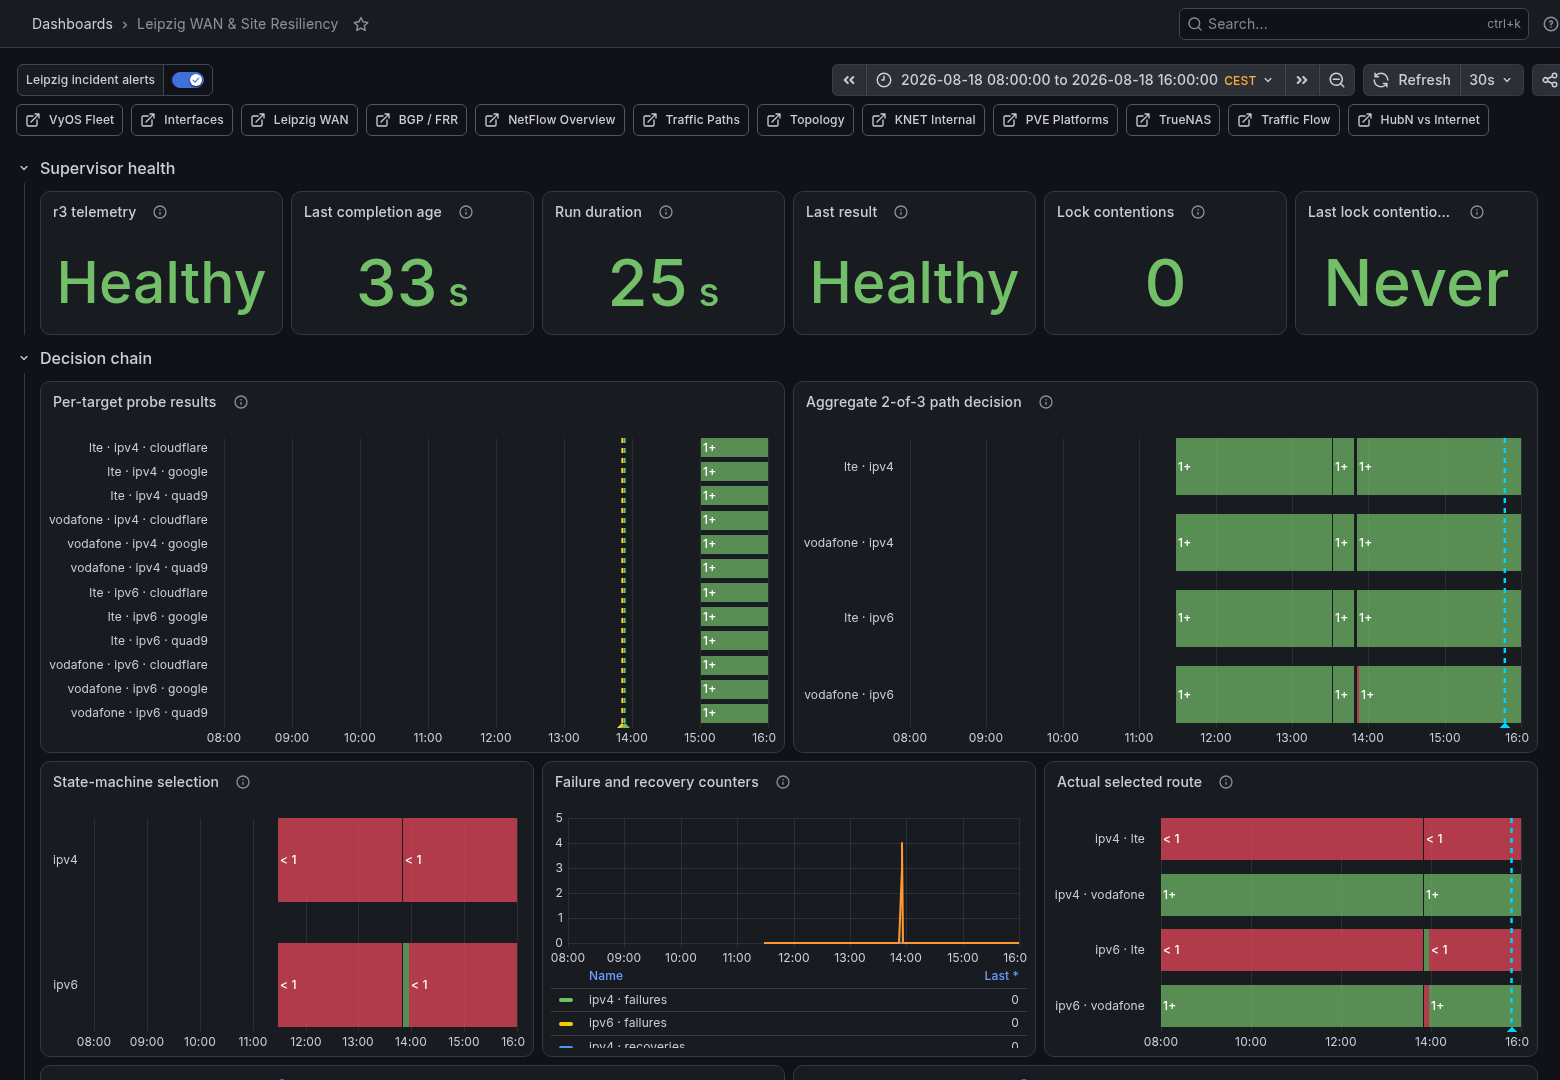
The decision chain over the incident day. The older aggregate metrics retain the route event around 13:50; the new per-target and supervisor detail begins after deployment later that afternoon. Prometheus does not invent samples from before a metric existed.
Reconciling supervisor state with live routes
The lock bug was not the only correctness problem the incident exposed.
The supervisor’s state file could be right while the live default route was wrong. The file records the last decision the script completed. It cannot prove that FRR still has the expected administrative distances, that a later VyOS commit did not restore the configured defaults, or that the kernel is actually using the interface implied by the state.
IPv4 now reconciles those facts on every run. The supervisor parses only exact owned default routes with numeric distances. Missing or duplicate routes are deliberately converged, changes are verified in FRR, and the transition is not recorded until the kernel-selected interface agrees. If any of those checks fail, the transition remains retryable.
IPv6 needs a different mechanism. The mobile line learns its default gateway from a router advertisement, so rejecting that RA would also throw away the information needed to use the backup. r3 continues accepting the learned mobile default. While the primary is healthy, the supervisor owns a separate primary route with a better metric and verifies that it outranks the RA. During failover it removes only that owned route, leaving the learned backup intact.
This is why I am not using VyOS’s native WAN load-balancing feature. It is old Vyatta machinery, it does not provide the dual-stack behaviour I need, and it wants ownership of routing and firewall state which this router already manages explicitly.
The two address families remain independent. Route changes remain runtime-only, so a reboot returns to the reviewed VyOS configuration. Connection tracking cleanup is scoped to the family which changed rather than flushing unrelated sessions.
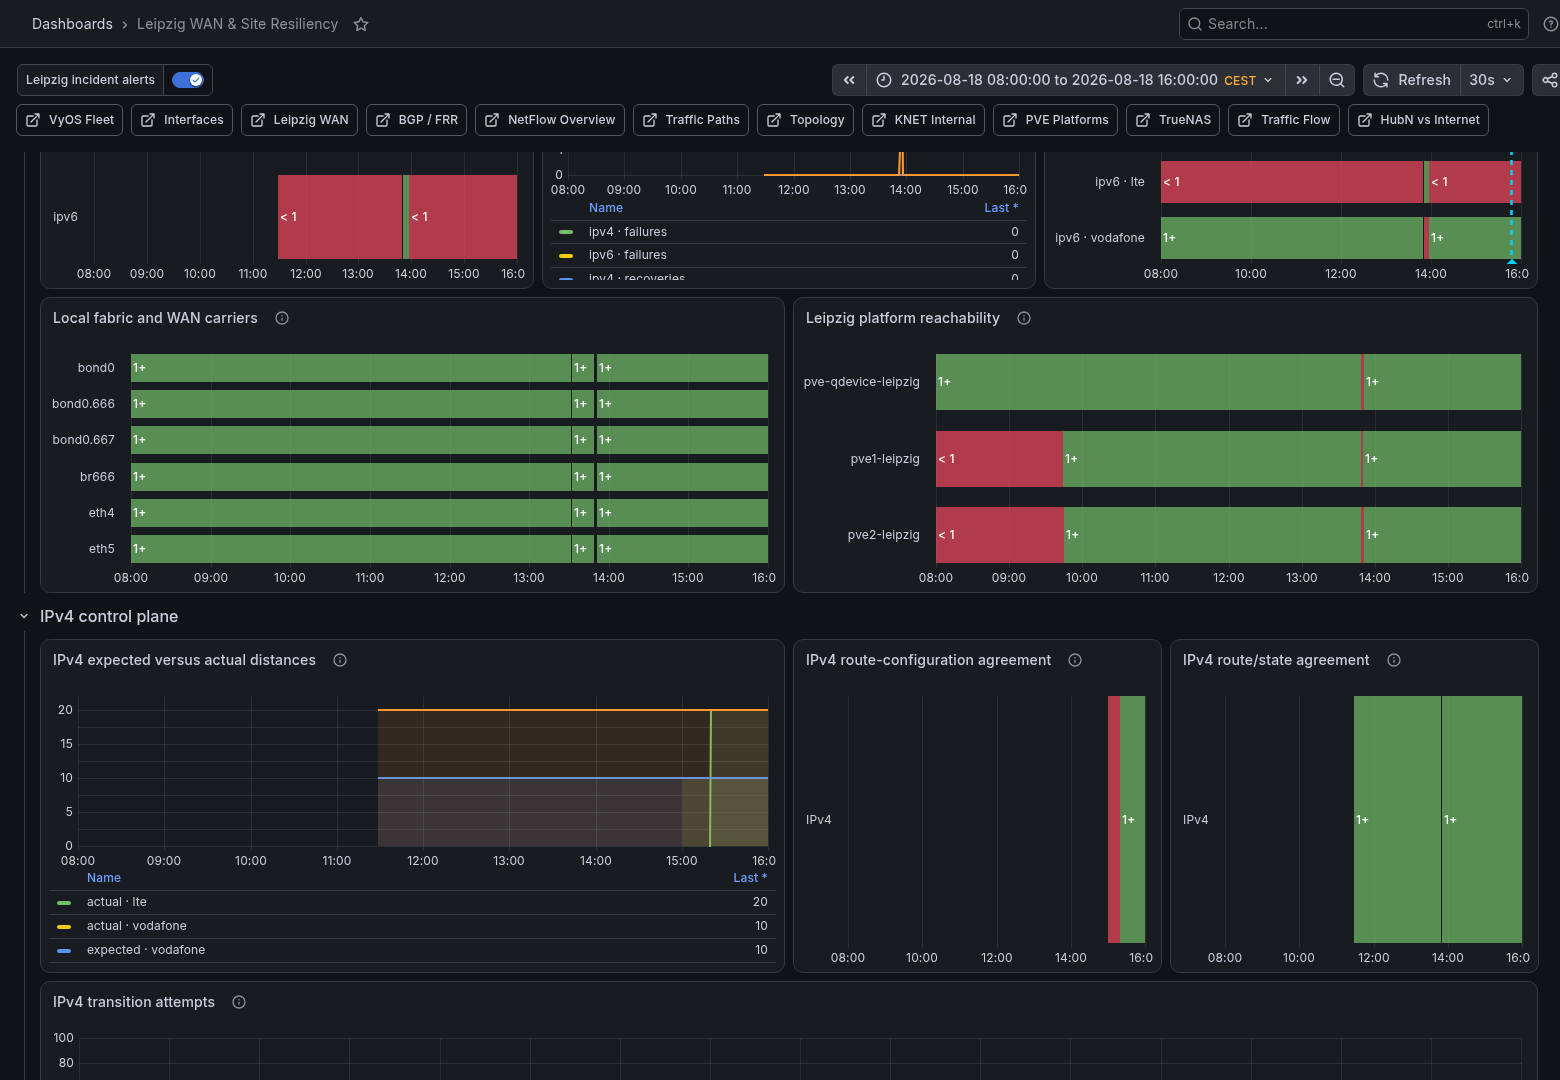
The control-plane view after the hardened collector was deployed. Configuration intent, routing-daemon state and kernel selection are three separate pieces of evidence.
Making the Supervisor Boring
Once I was touching the script, I removed several other ways it could become interesting during an outage.
Runtime state now lives under /run, is validated when read, and is written through temporary files followed by an atomic rename. Corrupted counters or unknown state names are rejected rather than fed back into routing decisions.
Policy-rule cleanup and route deletion loops are bounded. Probe commands have per-command timeouts and the complete invocation has a watchdog. Dry-run mode no longer creates state or lock files. The notification credential is deployed separately as vaulted, root-readable material rather than living in the script.
The probes themselves now retain useful quality information. Each address family and path tests three independent targets. The two-of-three result still drives the state machine, but Prometheus also receives each target result, packet loss and round-trip time. One bad target can therefore appear as degradation without being misreported as a dead WAN.
I added regression cases for FRR restarts, VyOS commits during failover, missing and duplicate defaults, partial transitions, kernel-route disagreement, changing or expired router advertisements, damaged state, bounded cleanup, overall deadlines and genuinely write-free dry runs. None of this required deliberately taking a production WAN offline.
Building the Incident Dashboard
The old monitoring could tell me that Vodafone probes had failed, LTE was carrying traffic or a local carrier had dropped. It was much less good at showing the complete decision chain on one timeline.
The expanded Leipzig WAN dashboard is arranged in the order I investigate a problem:
- Supervisor health: completion age, duration, result and lock contention.
- Decision inputs: every target, packet loss, RTT and the aggregate two-of-three path result.
- State-machine progress: consecutive failure and recovery counters plus transition attempts.
- Control-plane state: expected and actual IPv4 distances, IPv6 owned-route state, mobile RA presence and remaining lifetime.
- Data-plane result: the default path the kernel actually selected.
- Correlation: local LACP/carrier events, downstream platform reachability, WAN traffic, errors and drops.
The selected-range summaries calculate degraded primary time, time routed over LTE, attempted and successful transitions, supervisor skips, failed-run time, carrier drops and route-disagreement time. Grafana alert annotations sit on the same history.
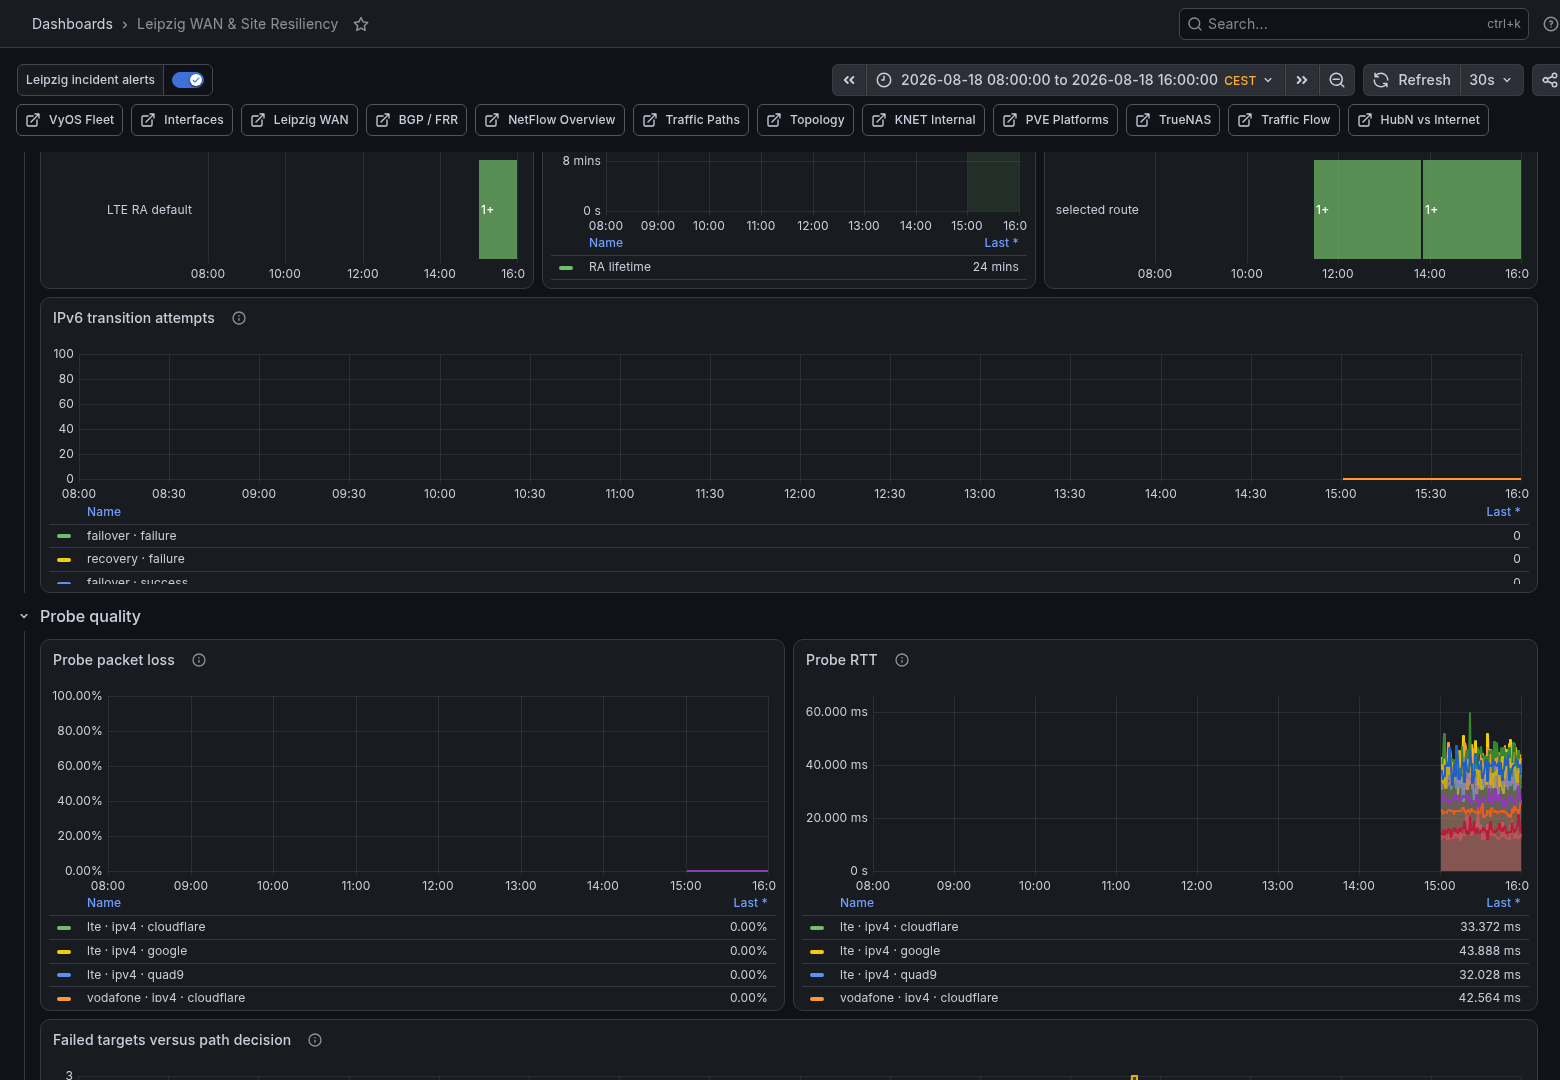
Probe quality after deployment. The mobile path is slower, as expected, but all targets are reachable and the aggregate path decisions remain healthy.
There are alerts for a stale or failed supervisor, a run approaching the scheduler interval, any lock contention, repeated transition failure, route configuration disagreement, a missing or expiring mobile RA and an unavailable backup while the primary is still active. A single degraded probe target is deliberately a non-paging warning.
The metrics use fixed labels. The expanded contract adds 53 series, bringing the complete WAN metric family to 88 on the live collector. Prometheus remains the historical store; the router does not write a high-frequency diary into persistent configuration storage. Retention is capped by both time and size, and host disk alerts are set to fire before Prometheus can reach that storage ceiling.
I also added a report generator for longer investigations. It writes Markdown for a human incident summary, CSV for timelines and JSON retaining the evidence and query metadata. The report distinguishes observed facts from inferred cause and can classify the likely failure domain as provider reachability, backup unavailability, local switching, control-plane drift, supervisor failure, downstream platform failure or ambiguous.
What I Can Prove Now
The most useful result is not that the graph is green again.
I can now prove that a scheduled run completed recently, how long it took, what every probe target returned, how the aggregate decision was reached, which transition was attempted, whether the routing daemon accepted it and which interface the kernel selected. If the router and state file disagree, that disagreement has its own history instead of being discovered during an SSH session.
The dashboard also preserves the difference between the two incidents from this morning. The switch update appears as a local carrier event with a downstream platform impact. The later IPv6 event appears as failed primary probes, one address-family transition to LTE, two skipped supervisor runs and then recovery. They happened on the same router and involved some of the same alerts, but they did not have the same cause.
What looked like a failed failover was a successful route transition followed by a blind supervisor. The fix was not to make the state file more authoritative. It was to make the script continuously reconcile state with the actual control and data planes, keep optional work outside the lock, and leave enough evidence to reconstruct the result later.
Previously: Making KNET Behave Under Load and Monitoring KNET and HubN.